Frequencies and Percentages
Introduction
When using Codeit, it is often useful to know how often, in total, each code in the Codeframe has been used.
This may be useful during coding to guide the coder, or as an exported report providing a summary to a client.
This document explains how these numbers are calculated and how to access them in Codeit.
Accessing Frequencies and Percentages
-
Coding/Verify
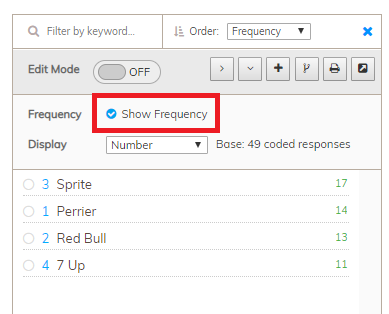
When using the coding screens (block/guided/sequential) you can display the frequencies by ticking the Show Frequency checkbox in the codeframe header.
The frequency for each codeframe item is then displayed to the right of the label:
Once frequencies are enabled, you can choose to display percentages, frequencies or both using the "Display" dropdown.
-
Export
To export a summary report containing counts and frequencies, click the "Export Data" button "Codeframe Summary" from the "Export Type" dropdown.
[Note: This functionality is due for release in version 3.6]
-
Admin
Frequencies and Percentages are not displayed when viewing the Codeframe in the Admin section of Codeit.
Since Codeframes can be shared across tasks, waves and projects the Admin section does not have a clear scope (see below) to base the frequency and percentage numbers on.
Scope
The frequency and percentage values generated by Codeit are based on the verbatims defined in scope at the time.
The verbatims in scope may vary depending on the current context as follows:
| Context | Scope |
|---|---|
| Coding Screens | All responses for the selected wave and question being coded |
| Codeframe Summary Export | The selected project(s), wave(s) and question(s) selected for export |
Calculating Frequencies
Calculating the frequency values for each Codeframe item is simple - it is simply the number of times a code has been applied within the current scope.
Consider the following example:
[Question: "What are your favourite drinks"?]
| Respondent | Verbatim | Codes |
|---|---|---|
| 1 | Coke | 1 |
| 1 | Coke | 1 |
| 1 | Coke | 1 |
| 2 | Coke and Fanta | 1;2 |
| 3 | Fanta | 2 |
The frequencies in this case are:
| Code | Frequency |
|---|---|
| Coke | 4 |
| Fanta | 2 |
Calculating Percentages
Although frequencies are response based, percentages are respondent based.
So, for a given code, the percentage is the number of respondents who have this code applied divided by the total number of respondents with at least 1 code applied within the current scope.
Consider again the following example:
[Question: "What are your favourite drinks"?]
| Respondent | Verbatim | Codes |
|---|---|---|
| 1 | Coke | 1 |
| 1 | Coke | 1 |
| 1 | Coke | 1 |
| 2 | Coke and Fanta | 1;2 |
| 3 | Fanta | 2 |
The percentages are therefore calculated as follows:
| Code | Base (all coded respondents) | Distinct Respondent Count | Percentage |
|---|---|---|---|
| Coke | 3 | 2 | (2/3) = 67% |
| Fanta | 3 | 2 | (2/3) = 67% |